

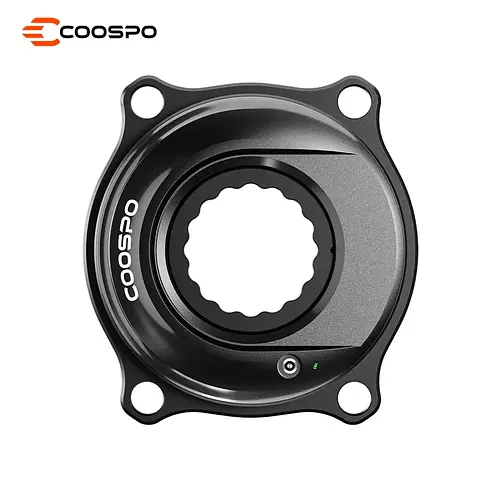
Coospo S10 (Exemplar 2) - Nullung mitten in der Fahrt (COROS Bluetooth)
September 22, 2026
What we recognised
One file names a power meter we recognise, so the roles were assigned from the recordings themselves.

- Claimed Accuracy (± %)
- 1
- Max Power
- 3000 W
- Sensor location
- Pedal
- Sidedness
- Dual-sided (true left/right)
Favero Electronics
#365767266 · v62.40
recorded by Wahoo Fitness
- Claimed Accuracy (± %)
- 1
- Max Power
- 2800 W
- Sensor location
- Spider
- Sidedness
- Total power (both legs combined)
No power meter identity in this file
recorded by Coros
Aligned on cadence. Matching on power instead would have said 0 s; cadence is the one to trust.
What each meter read
The same two files give a different answer depending on which seconds you count, and the sign can flip. Only the highlighted row is comparable between meters.
| COROS Bluetooth | iGPSport ANT+ | |||||
|---|---|---|---|---|---|---|
| Definition | Meter under test | Reference | Difference | Meter under test | Reference | Difference |
All shared seconds Mean over every second the two files share, coasting included. | 212.4 W | 219.7 W | -3.3 % | 215.8 W | 220.5 W | -2.1 % |
Excluding zero seconds Mean over the seconds where both meters read above 0 W. | 229.5 W | 232.6 W | -1.3 % | 224.1 W | 228.8 W | -2.1 % |
Pedalling only (>50 W / >50 rpm) Mean over the seconds where both meters read above 50 W and above 50 rpm. | 230.5 W | 238.9 W | -3.5 % | 226.3 W | 237.1 W | -4.5 % |
Median, excluding zeros Middle value of each meter's own non-zero seconds. The two can cover different seconds. | 221.0 W | 226.0 W | -2.2 % | 219.0 W | 226.0 W | -3.1 % |
Normalized Power (30 s) 30 s rolling mean, raised to the fourth power, averaged, then the fourth root. The fourth power weights hard intervals far above steady riding, so on a variable ride this lands well over the plain average and tracks how taxing the hour was rather than how much work it was. Spans pauses, as the definition requires. Normalized Power is a trademark of Peaksware, LLC. | 232.0 W | 239.5 W | -3.1 % | 232.1 W | 239.5 W | -3.1 % |
Total work Every watt summed over the shared seconds, in kilojoules. | 503.7 kJ | 521.2 kJ | -3.3 % | 503.8 kJ | 514.7 kJ | -2.1 % |
The ride, second by second
Both meters over the whole ride, with the gap between them below.
A triangle on the zero line is a dropout: that meter logs 0 W while the other one measures pedalling. Drag across the chart to zoom into that stretch, scroll to zoom, or step with + and − above. The slider underneath pans both panels together.
Scaling error or constant offset?
Constant offsetThe slope is about 1 with a constant torque surplus on top. A percentage correction cannot fix this: it would overcorrect at low power and undercorrect in a sprint.
- Gain
- +1.8 %
- Offset
- -1.07 Nm
- at this cadence
- -10 W
- r
- 0.9888
Read the watt column, not the percentage: a constant number of watts with a falling percentage is an additive offset.
| Band | Reference | Meter under test | Δ W | Δ % | Δ Nm |
|---|---|---|---|---|---|
| 130–180 W | 165.5 | 163.4 | -2.0 | -1.2 | -0.14 |
| 180–230 W | 206.7 | 200.5 | -6.2 | -3.0 | -0.58 |
| 230–280 W | 253.9 | 245.7 | -8.2 | -3.2 | -0.74 |
| 280–340 W | 294.3 | 286.4 | -8.0 | -2.7 | -0.65 |
| 340–450 W | 383.2 | 389.8 | +6.7 | +1.7 | +0.41 |
Power curve
Best efforts inside a single unbroken stretch of the ride, which here is 1215 s long. Computed across a pause the curve would turn back upward, which a power curve never does.
Peaks shorter than five seconds compare sampling behaviour as much as power. Power meter technologies (spider, pedals, crank arm, hub) measure and transmit at different rates, so two units can differ over a short peak by design. Those points are drawn hollow.
Evaluation version 1. Results are only comparable within the same version.